Find the equilibrium constant and the binding stoichiometry | Homework Help
Foundations of Biomedical Science Exam
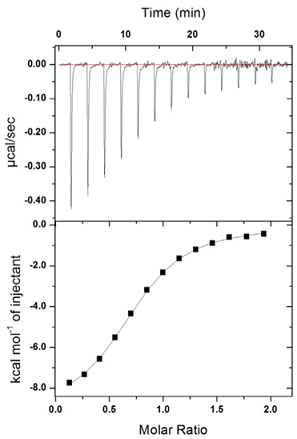
This figure represents an isothermal titration calorimetry experiment. Protein X and ligand Y interact inside a calorimeter chamber. The experiment is done like this:
Don't use plagiarized sources. Get Your Custom Essay on
Find the equilibrium constant and the binding stoichiometry | Homework Help
For $10/Page 0nly
- 200 ?l of a 2 ?M solution of protein X is placed inside the calorimeter chamber.
- A titration syringe is loaded with a solution containing Y (60 ?M).
- At each point in time, as shown in the upper panel, 1 ?l of the Y solution is injected into the calorimeter chamber. This injection results in the release of heat, as shown in the upper graph. The amount of heat being released changes with each injection because the binding sites are being saturated and there are fewer available sites to bind the ligand.
- Thus, the number of mols of X in the chamber remains constant, whereas the number of mols of Y increases with every injection.
- The experiment was done at 25°C
The heat released can be measured by the area of each one of the peaks shown in the upper panel. Calorimeters come with software that does this automatically for you and generate curves like that shown in the lower panel. The software corrects for the small dilution of X in the chamber (after 13 injections the volume has increased from 200 to 213 ?l assuming that nothing gets removed). Therefore, the Molar Ratio (mols of Y/mol of X in the chamber) is an accurate number. The analysis software extracts several parameters from these data: ?H, ?S, K (equilibrium constant), and some estimate of the stoichiometry of the reaction.
Your job is to replace the instrument’s software with your understanding of the analysis methodology. In other words, you must calculate the thermodynamic numbers associated with this reaction. You can do this using Excel or a piece of software available for download from the University (Prism). Because you need to plug in some numbers, there is a piece of freeware that is very useful for the digitation of plots (Plotdigitizer: http://plotdigitizer.sourceforge.net). If you don’t want to use Plotdigitizer, you can always extract the data using a ruler and measuring distances to the X and Y axes.
These are your tasks:
1. Transform the lower graph into a classical binding isotherm and plot Bound [Y] vs Free [Y] (or Bound [Y] vs log Free [Y]).
2. Calculate the equilibrium constant and the binding stoichiometry.
3. If the stoichiometry is not 12, please discuss your result.
4. Calculate the ?H and the ?S of the reaction. The SIGNS are important.
Calculator
Our features
We've got everything to become your favourite writing service
Money back guarantee
Your money is safe. Even if we fail to satisfy your expectations, you can always request a refund and get your money back.
Confidentiality
We don’t share your private information with anyone. What happens on our website stays on our website.
Our service is legit
We provide you with a sample paper on the topic you need, and this kind of academic assistance is perfectly legitimate.
Get a plagiarism-free paper
We check every paper with our plagiarism-detection software, so you get a unique paper written for your particular purposes.
We can help with urgent tasks
Need a paper tomorrow? We can write it even while you’re sleeping. Place an order now and get your paper in 8 hours.
Pay a fair price
Our prices depend on urgency. If you want a cheap essay, place your order in advance. Our prices start from $11 per page.